As we navigate adulthood, dealing with taxes and bills becomes a regular part of life. Our electricity bills, in particular, shed light on our daily habits and lifestyle choices.
Now, with Singaporeans having more say thanks to the open electricity market, we’re curious to learn more. So, we reached out to 101 fellow Singaporeans to learn about their average electricity bills, lifestyle habits, and what they make of it all. Join us as we explore and uncover some fascinating insights together!
Note!
For reference purposes, here is a PDF version of our survey questionnaire.
Average Monthly Electricity Bill in Singapore
The survey data provides a breakdown of the number of respondents within different ranges of electricity bill spending. To calculate the average spending, we sum up the total spending across all respondents in each spending range and then divide by the total number of respondents.
Average Electricity Bill by Household Type
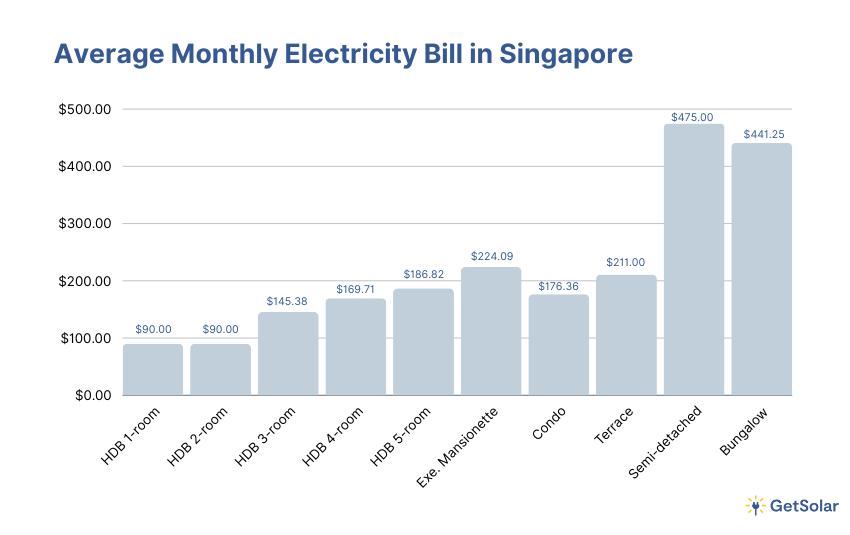
We’ll compare each average spending with the lowest average spending ($90.00, corresponding to 1-room and 2-room flats)
The cost of electricity bills correlate to the size of a home, and how luxurious it is.
For example, executive maisonettes, semi-detached houses, and bungalows typically incur triple the electricity costs of 1 and 2-room flats. In comparison, condominiums have lower average bills than executive maisonettes, with costs averaging at $176.36 and $224.09, respectively. The difference in electricity costs are highly attributed to the fact that condos are generally smaller than executive maisonettes.
Other factors that could affect household electricity expenses could be simply using energy-efficient appliances or practising sustainable habits.
Average Electricity Bill by Number of Persons Residing in the Household
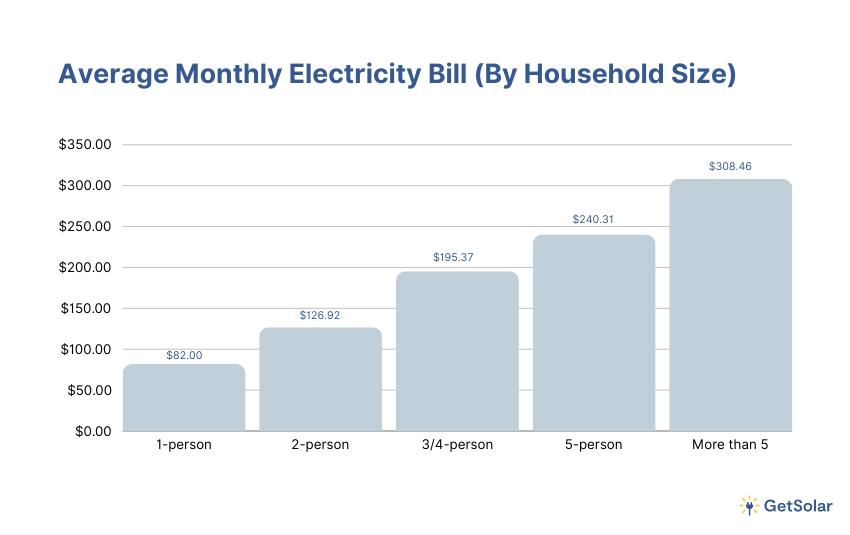
We’ll compare each average spending with the lowest average spending ($82.00 for a 1-person household) and calculate the percentage difference.
As expected, electricity costs generally increase as more people live in a household, but the rate of increase tends to moderate as the household size grows.
For instance, while the cost jumps significantly by 53.92% when moving from a 2-person household to one with 3 or 4 people, the increase is less sharp, at 23%, when expanding from a 3 or 4-person household to one with 5 people.
The rate of increase further slows to 28.36% as households expand beyond five members. This pattern indicates that while larger families do use more electricity, the incremental cost increase becomes much more gradual as household size continues to grow.
Does Your Choice of Electricity Retailer Make a Difference?
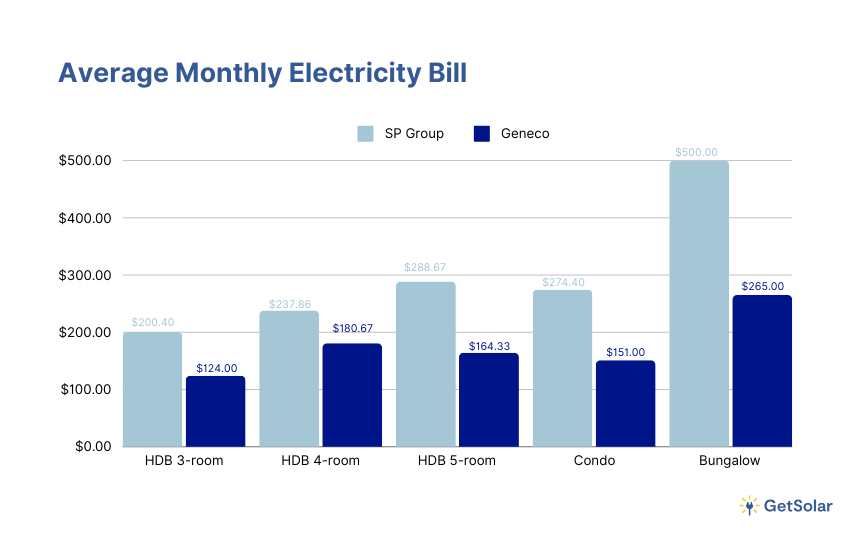
From a survey of 101 participants, 61 (about 60.4%) use SP Group, while 17 (16.8%) are with Geneco. The rest are distributed among various other retailers.
Notably, Geneco users reported lower average electricity costs than those with SP Group. In the second quarter of 2024, for instance, Geneco’s rate was 28.98 cents/kWh for a 12-month contract, which undercuts SP Group’s rate of 31 cents/kWh. This pricing difference likely contributes to the trend observed.
If you’re looking to reduce your electricity bills or considering a switch, check out our updated guide on the best electricity plans in Singapore. It includes a handy visual chart that compares the most cost-effective plans from each provider, simplifying your decision-making process.
Other Factors Influencing Electricity Costs
Air Conditioning Usage
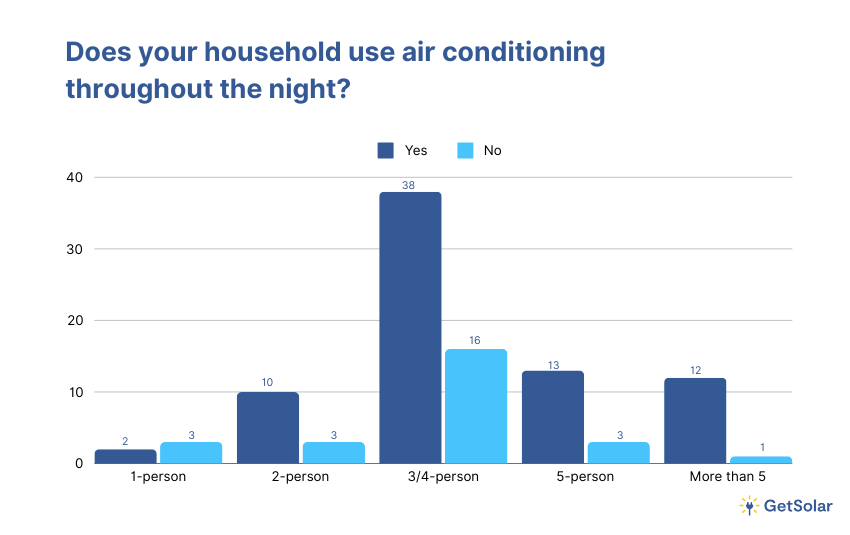
The data from these charts clearly show that air conditioning is a significant driver of higher electricity bills. Households with 3-4 people tend to use air conditioning for extended periods, often between 7-9 hours, compared to those with five or more people.
This pattern suggests that 3-4 person households might run their air conditioning for longer periods compared to larger households in Singapore. This could be due to greater personal space and the ability to individually control the temperature in separate rooms, getting much more comfortable in Singapore’s heat, but also raising electricity costs.
Usage of Energy Efficient Appliances
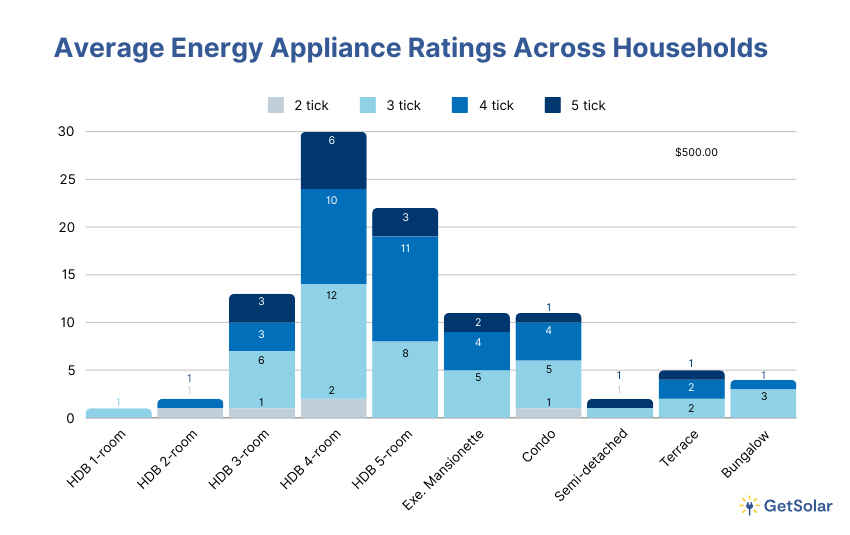
In executive maisonettes, 45.5% of households use appliances rated with three energy efficiency ticks, 36.4% with four ticks, and 18.2% with five ticks. Condominiums show similar trends, with 9.1% using two-tick appliances, 45.5% with three ticks, 36.4% with four ticks, and another 9.1% with five ticks.
This data suggests that residents of larger living spaces are more energy-conscious. The higher electricity usage that typically comes with large living spaces likely motivates the choice of switching to energy-efficient appliances.
Specifically for 4-room HDB with 3-4 occupants, a comparison between 3-tick and 5-tick appliances reveals significant differences in energy efficiency.
Households using 3-tick appliances have an average monthly electricity bill of $220.63, whereas those with 5-tick appliances spend only $151 on electricity. This results in monthly savings of about $69.63 by opting for more energy-efficient 5-tick appliances.
Dryer Machine Usage
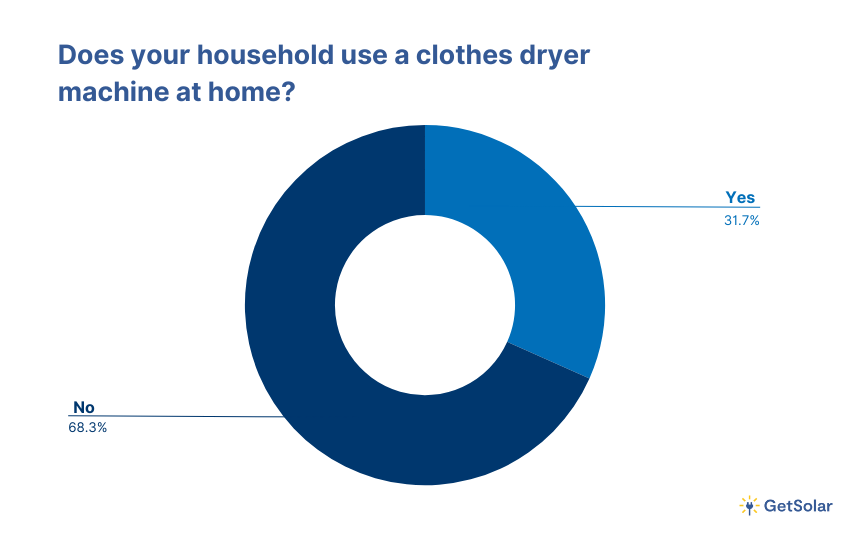
Although air conditioning is a known contributor to their monthly expenses, the primary factor driving up the electricity bill is a clothes dryer, despite their convenience. Fortunately, 68.3% of respondents do not own this heavy consuming appliance.
A user named Woshileeroy on Hardware Zone has highlighted the significant impact certain appliances have on electricity bills. Supported by insights from an article by Renewable Energy World, it becomes clear that appliances which generate heat, such as clothes dryers, typically use more electricity than those designed to cool.
Awareness of Electricity Consumption
Trends in Household Electricity Monitoring
Approximately 90% of respondents monitor their household electricity consumption through monthly bills, while the remaining 10% leverage technology to track real-time usage. Examples of these tracking systems are smart meters and mobile apps like the SP Group App.
These findings indicate a growing trend towards awareness and proactive management of electricity usage in homes. This also suggests that more households are becoming interested in tools that offer detailed and immediate feedback on their energy patterns, as compared to monthly bills.
Adoption of Energy-Saving Strategies
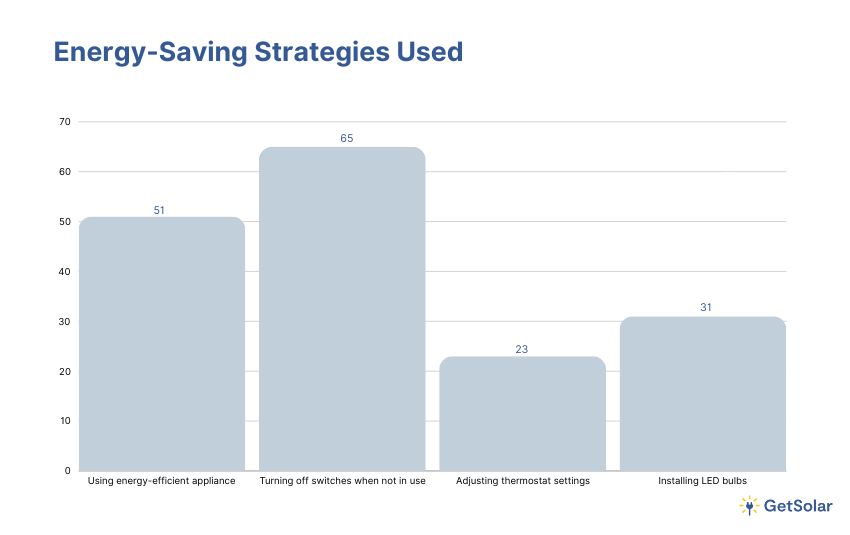
The trend in this section displays the energy-saving methods adopted by homeowners. 43% of these individuals are taking further steps by investing in energy-efficient LED bulbs and adjusting thermostat settings. This highlights the collective effort toward reducing electricity consumption and promoting sustainability within households.
How to Further Save on Your Monthly Utility Bills
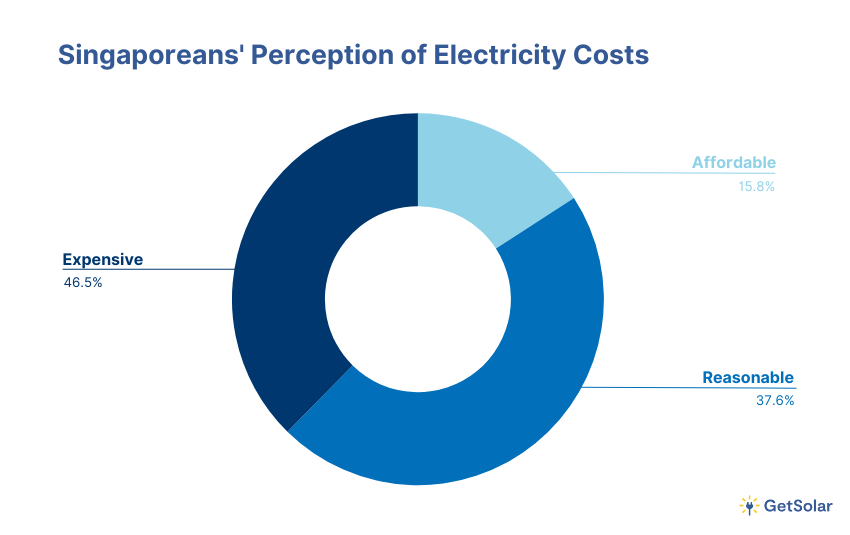
Around 38% of the respondents expressed that Singapore electricity bills are expensive. Among these individuals, approximately 61% indicated they would consider switching to renewable energy sources if they were more accessible and affordable.
This suggests a significant relation between the perceived cost of electricity bills and the willingness to adopt renewable energy alternatives.
Install Solar Panels on Your Roof
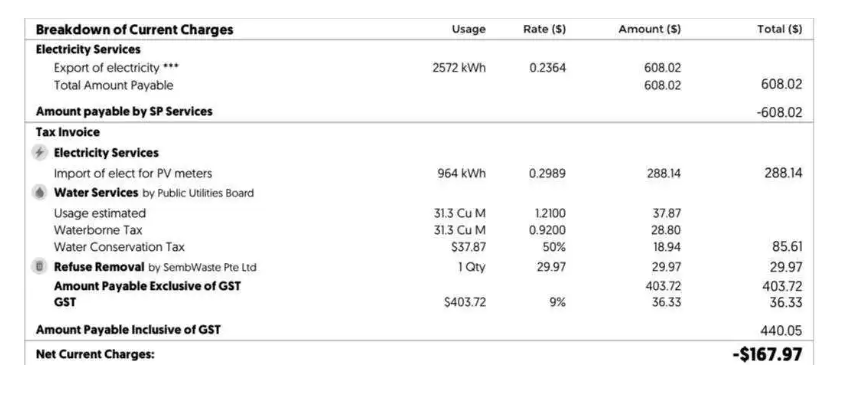
As such, switching to solar could be a game-changer, especially on your electricity bills; Having solar panels on your roofs in sunny Singapore allows you to generate your own electricity instead of having to fully depend on the grid.
So what does this mean? You get to significantly slash your electricity bills. In some cases, even a negative bill, where your electricity provider pays you! How amazing is that?
This is just one example of how solar can impact your life, read our article on the benefits of solar panels for even more goodies that come with installing solar panels!
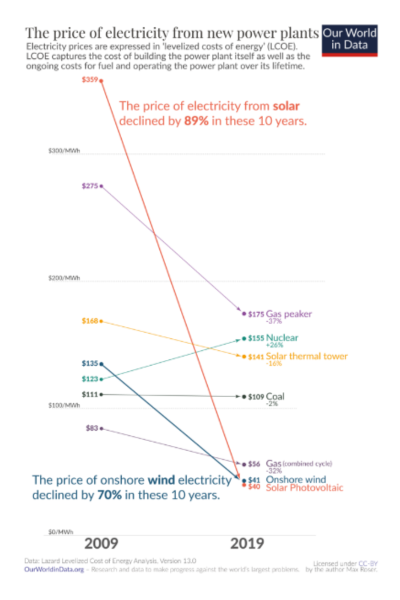
Price of Solar Panels
You may be concerned about the hefty price that comes with solar panels. Fret not, the prices for solar panels have significantly dropped by 89%, making solar significantly affordable than a decade ago.
Furthermore, here at GetSolar, we’re committed to making solar way more affordable and accessible. That’s why we offer the Rent-To-Own programme, omitting the need for high upfront costs — imagine paying $0 upfront and complimentary repairs and maintenance for solar panels!
Try our solar simulator and get a free quote in minutes!

Methodology
We gathered our data through a Google survey conducted among residents in Singapore. The distribution of the survey primarily relied on word-of-mouth referrals and sharing within appropriate social groups on platforms like WhatsApp and Telegram.
Survey Respondents’ Demographic Profile
Age Distribution
The survey findings reveal a notable diversity in the age distribution of respondents, painting a vivid picture of electricity consumption habits across different life stages. More than half of the respondents (52.5%) were in the age bracket of 25 to 34 years old; Additionally, 11.9% of respondents were aged between 35 and 44, while 13.9% were in the 45 to 54 age range.
Household Type
The survey findings reveal a varied distribution of respondents across different types of housing in Singapore. Among the respondents, 29.7% lived in 4-room HDB flats, making it the most common housing type represented in the sample. Following closely behind, 21.8% of respondents resided in 5-room HDB flats, while 10.9% lived in executive maisonettes and another 12.9% in 3-room HDB flats. Additionally, 10.9% of respondents lived in condominiums, adding to the diversity of housing types in the survey sample.
Number of People Residing in the Household
The survey reveals diverse household sizes among respondents, reflecting various living arrangements in Singapore. The majority of respondents, comprising 53.5%, lived in households with 3 to 4 members. Additionally, 15.8% of respondents resided in households with 5 members, while another 12.9% lived in households with 2 members. Interestingly, an equal percentage of respondents, also 12.9%, reported living in households with more than 5 members, showcasing the range of household sizes represented in the survey sample.